If you remove a few key stocks, the growth of the S&P 500 would be cut by 70%
The exceptional performance of growth stocks within the S&P 500 has emerged as a significant market trend. Over the past two years, the S&P 500 Growth Index has surged by 57.3%, significantly outpacing the overall S&P 500’s 41.6% rise and the S&P Value Index’s 23.8% gain. In the past month alone, the growth index has outpaced value by nearly 9%. Interestingly, despite this rapid ascent, only 40% of the stocks in the growth index have generated a positive return in the last month. This paradox is worth exploring.
To understand this trend, it’s essential to clarify the definitions of growth and value stocks. According to the S&P Dow Jones methodology, each of the 500 stocks in the S&P 500 is assigned scores based on their growth and value characteristics. Companies that score high in sales growth, the ratio of earnings change to price, and momentum are categorized as growth stocks. Conversely, companies scoring well for book value, price-to-earnings ratio, and sales-to-price ratios are classified as value stocks.
The S&P 500’s performance is highly influenced by a few giants like Apple & Microsoft, creating concentration risk. This imbalance is at historic highs, often preceding market downturns. Diversification is key! 📈🔑 #Investing #SP500 #MarketRiskhttps://t.co/WF5yrY8iiI pic.twitter.com/uHbkTvPOl6
— Shorebreak Capital (@ShorebreakFunds) June 17, 2024
Over the past two years, investors have gravitated towards growth stocks, driving up the prices of companies like Microsoft, Nvidia, and Apple. These companies have consistently outperformed expectations in terms of revenue and profit growth, earning substantial gains in their share prices and rising valuations. The price-to-earnings (P/E) ratios for these stocks have also increased, with the P/E ratio of the S&P 500 Growth Index expanding to 34.9x from 25x at the start of the year. In contrast, the P/E ratio of the S&P 500 Value Index has declined to 18.7x from 20x in January.
Despite the general enthusiasm for growth stocks, the overall performance is driven by a small number of mega-cap stocks. While many stocks are classified as growth, only a handful of these large-cap stocks are propelling the index higher. Over the last month, the S&P 500 Growth Index returned 6.9%, yet the average stock had a negative return of 1.6%. This divergence indicates that either a few stocks had exceptionally high returns, or the largest companies in the index outperformed the smaller ones.
Meanwhile, Apple has again become the largest company in the world, surpassing Microsoft and Nvidia.
S&P 500 ended up for 7th week out of last 8
It has been 329 days since S&P 500 posted a decline of 2% or more, the longest streak since February 2018👇https://t.co/vPcV3UAosp
— Global Markets Investor (@GlobalMktObserv) June 17, 2024
Analyzing the index by market capitalization reveals that the largest 10% of companies, with an average market capitalization of over $1 trillion, drove all the returns of the S&P Growth Index. Only one other market cap decile had positive returns, while all other deciles experienced negative returns over the last month. Stocks in the smallest 10% of the index had an average return of -5%, while the top decile, including Microsoft, Nvidia, and Apple, had an average return of 5.7%. The top ten stocks in the S&P 500 Growth Index hold more than a 60% weighting, making them responsible for over half of the index’s returns.
This growing concentration of returns among a few mega-cap stocks has been beneficial for index investors so far. Companies like Microsoft, Nvidia, and Apple have been delivering on high revenue and earnings expectations, leading to their continued dominance and the rising indices.
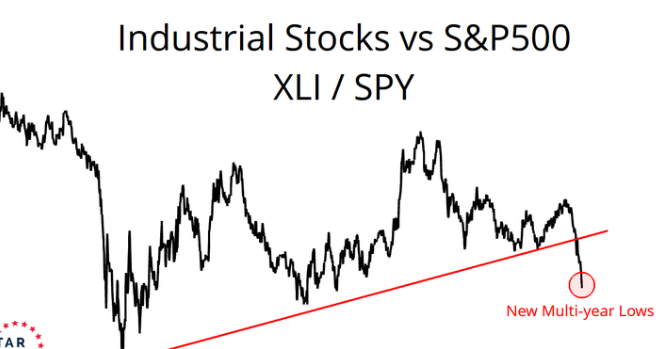
The chart plots the ratio of XLI (Industrial Select Sector SPDR Fund) to SPY (SPY, the SPDR S&P 500 ETF Trust), indicating how industrial stocks are performing relative to the S&P 500 index, currently dominated by a few tech related stocks, as in Apple (AAPL), Microsoft (MSFT),… pic.twitter.com/DZpn0I9JK2
— g (@antzmrah) June 17, 2024
However, this trend carries risks. If the AI boom slows or the economy stalls, the premiums investors are willing to pay for these leading growth stocks could decrease. This concentration increases market volatility, as the same few companies driving the market higher today could lead it lower tomorrow. Investors should remain vigilant and prepared for potential shifts in market dynamics due to the dominance of these mega-cap growth stocks.
Key Points:
i. Exceptional Performance: The S&P 500 Growth Index has surged by 57.3% over the past two years, outperforming the overall S&P 500 and the S&P Value Index.
ii. Concentration of Returns: Despite the index’s overall growth, only 40% of the stocks in the growth index have generated positive returns recently, with a small number of mega-cap stocks driving the majority of gains.
iii. Growth vs. Value Stocks: Growth stocks, like Microsoft, Nvidia, and Apple, have seen significant price increases and higher P/E ratios, while value stocks have experienced declining P/E ratios.
iv. Market Cap Analysis: The largest 10% of companies in the S&P 500 Growth Index, with average market caps over $1 trillion, have driven all the returns, overshadowing the negative returns of smaller companies.
v. Potential Risks: The dominance of mega-cap growth stocks increases market volatility, and any downturn in these stocks, due to factors like an economic slowdown, could lead to significant market declines.
TL Holcomb – Reprinted with permission of Whatfinger News


